Writing the Results section often creates a deceptively difficult question: How long should the Results section of a research paper be? Too short, and important findings may appear underreported. Too long, and the section can become a data dump that repeats every table, figure, and statistical output.
There is no universal word count for a Results section. The appropriate length depends on the journal’s total manuscript limit, study design, number of research questions or hypotheses, complexity of the dataset, and the amount of information communicated through tables and figures.
For most journal manuscripts, the goal is not to hit a predetermined number of words. The goal is to present the findings necessary to answer the research questions completely, logically, and without interpretation that belongs in the Discussion.
This guide explains how to determine the appropriate research paper Results section word count, how to balance Results and Discussion sections, how thesis results chapters differ from journal articles, and how to structure data presentation for publication in 2026.
💡 Need expert help with your paper?
Transform your manuscript with ManuscriptLab’s professional editing & formatting services!
How Long Should the Results Section of a Research Paper Be?
The short answer is: as long as necessary to report the study’s relevant findings clearly, but no longer than the evidence requires.
Major publishing organizations do not prescribe a universal percentage or word count for Results. For example, the ICMJE recommends presenting results in a logical sequence and emphasizing the most important findings rather than repeating every data point contained in tables and figures.
As a practical planning range, many authors find that the Results section occupies roughly 15–30% of the main manuscript text, depending on the study design. This is a planning benchmark, not a journal rule.
A complex clinical trial with several prespecified outcomes may require substantially more Results text than a short observational study. A qualitative study may devote more space to themes and representative quotations, while a computational paper may communicate substantial findings through figures and supplementary data.
The journal’s author guidelines always take precedence over general benchmarks.
What determines Results section length?
Four factors usually have the greatest effect:
- The journal’s total word limit
- The number of primary and secondary outcomes
- The complexity of the analysis
- The number and type of tables and figures
For example, a 2,500-word article cannot allocate the same number of words to Results as a 4,000-word article. Similarly, a study with one primary outcome will normally require less Results text than a multicenter study reporting several prespecified endpoints and subgroup analyses.
The correct question is therefore not simply, “How many words should my Results section contain?” Instead ask:
Does every paragraph contribute directly to answering a research question, testing a hypothesis, or reporting a prespecified or scientifically relevant finding?
If the answer is no, revise or remove it.
A Practical Word-Count Framework for Research Papers
Use the following ranges as planning estimates rather than fixed requirements.
| Manuscript component | Practical planning range | Primary purpose |
| Introduction | 10–15% | Establish the research problem and objective |
| Methods | 20–30% | Explain how the study was conducted |
| Results | 15–30% | Report the findings |
| Discussion | 20–30% | Interpret findings and explain implications |
| Conclusion | 3–5% | State the principal takeaway |
These percentages are not formal publishing standards. A journal may require a different structure, combine sections, impose a strict total word count, or move technical material to supplementary information.
The distribution also changes according to study type. A systematic review, qualitative study, randomized controlled trial, observational study, or computational investigation may require very different amounts of Results text.
The important principle is proportionality. Results should be large enough to establish the evidence but restrained enough to leave sufficient space for interpretation and context.
Also read: 10 Key Reasons Manuscripts Get Rejected Before Peer Review
Results Section vs. Discussion: How Should You Balance Them?
One of the most common problems in manuscript preparation is allowing the Results and Discussion sections to perform the same job.
They should not.
The Results section answers: “What did the study find?”
The Discussion answers: “What do those findings mean?”
Current ICMJE guidance follows this distinction. Results should present findings in logical sequence, while Discussion should summarize the major findings, place them within existing evidence, explore explanations, acknowledge limitations, and discuss implications.
What belongs in Results?
Include:
- Participant or sample characteristics relevant to the analysis
- Primary outcomes
- Secondary outcomes
- Statistical estimates
- Confidence intervals
- Effect sizes
- Relevant P values
- Qualitative themes or categories
- Results of prespecified analyses
- Relevant subgroup or sensitivity analyses
- Findings associated with tables and figures
What belongs in Discussion?
Move interpretation into the Discussion, including:
- Why a finding may have occurred
- How the result compares with previous research
- Theoretical explanations
- Clinical or practical implications
- Unexpected findings and possible explanations
- Study limitations
- Recommendations for future research
For example:
Results:
“Participants receiving intervention A had a mean score 8.4 points higher than participants receiving intervention B (95% CI, 3.1–13.7; P = 0.002).”
Discussion:
“The higher scores observed with intervention A may reflect improved adherence to the treatment protocol.”
The first statement reports evidence. The second interprets it.
Why does this distinction matter?
When interpretation overwhelms the Results section, readers may struggle to distinguish the study’s actual observations from the authors’ explanations. Conversely, a Results section containing only raw numbers forces readers to reconstruct the study’s findings themselves.
Strong manuscripts establish a clear boundary while maintaining logical continuity between the two sections.
How to Structure the Results Section Efficiently
Do not begin writing by describing every statistical output. Start with the study’s research questions, hypotheses, or outcomes.
1. Organize Results around research questions
Structure the section in the same logical sequence established in the Methods.
A typical sequence might be:
- Participant/sample characteristics
- Primary outcome
- Secondary outcomes
- Prespecified subgroup analyses
- Sensitivity or robustness analyses
- Additional relevant findings
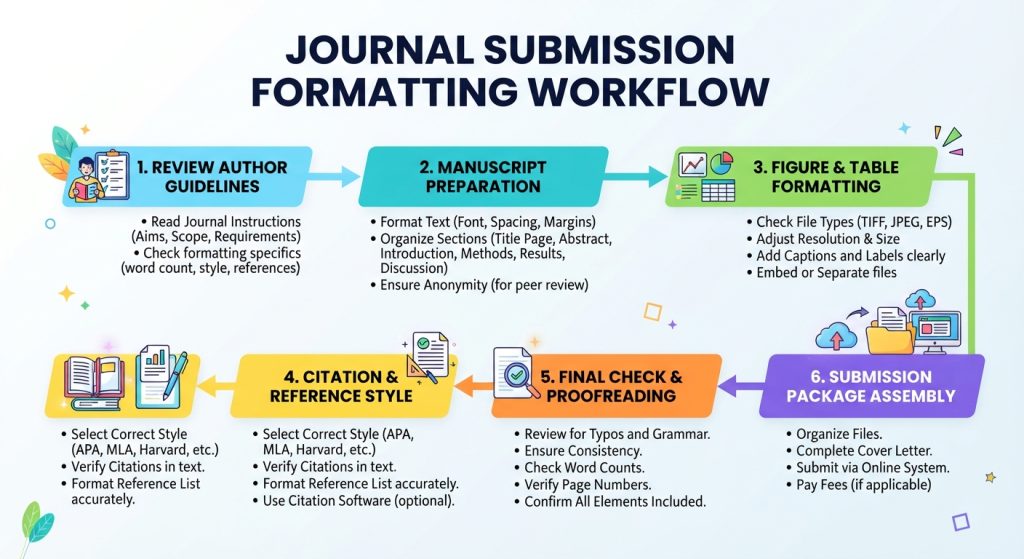
This creates a predictable manuscript submission workflow for reviewers.
If your Methods section identifies three primary research questions, the Results should make it easy to locate the evidence addressing each one.
2. Report the primary findings first
Do not bury the principal finding beneath demographic information or minor analyses.
The ICMJE recommends presenting the main or most important findings first. This is especially important when journal space is limited.
A useful test is to ask:
If a reviewer reads only the first few paragraphs of the Results, will they understand what the study found?
If not, restructure the section.
3. Use tables and figures strategically
Tables and figures are not substitutes for writing; they are information-compression tools.
A well-designed table can eliminate several paragraphs of repetitive numerical description. However, the text should still identify the important pattern or finding.
For example:
“Baseline characteristics were generally comparable between groups (Table 1).”
The accompanying table can contain the detailed demographic information.
In contrast, avoid writing:
“Table 2 shows that Group A had a mean value of X, while Group B had a mean value of Y…”
followed by a complete repetition of every value already visible in the table.
The ICMJE specifically advises authors not to repeat all data from tables and figures in the text. Explain the important observations instead.
How Many Words for a Research Paper Results Chapter?
The phrase “Results chapter” usually refers to a thesis or dissertation rather than a journal article.
This distinction matters because a thesis has substantially more room for methodological explanation, detailed analysis, supporting evidence, and chapter-level organization.
There is no universal thesis Results chapter word count. University regulations, discipline, degree requirements, research design, and thesis structure determine the appropriate length.
Some doctoral programs may have results or findings chapters running into several thousand words, while a thesis with multiple results chapters may divide findings across several shorter chapters.
For example, one institutional thesis-writing resource provides a sample distribution in which Results account for approximately 26% of the thesis. This should be treated as an example rather than a universal academic standard.
A useful thesis planning method
Instead of assigning an arbitrary number of words to the Results chapter, calculate the total thesis word allowance and divide it according to your research architecture.
For a 50,000-word empirical thesis, for example, you might initially allocate:
- Introduction: 4,000–6,000 words
- Literature review: 10,000–12,000 words
- Methods: 7,000–9,000 words
- Results/findings: 10,000–15,000 words
- Discussion/conclusion: remaining allocation
These are planning figures, not institutional requirements.
A thesis containing three substantial empirical studies may need three results chapters. A qualitative thesis may require extensive presentation of themes and participant quotations. A laboratory-based thesis may rely more heavily on figures, experimental outputs, and appendices.
Your department’s handbook and supervisor’s requirements override generic benchmarks.
Ideal Length for Scientific Paper Results: Think in Evidence, Not Words
The ideal length for scientific paper Results is determined by the amount of evidence required to support the study’s objectives.
Consider two hypothetical manuscripts.
Study A: Simple observational analysis
The study has:
- One primary research question
- 120 participants
- One primary outcome
- Two secondary outcomes
- Three tables
- Two figures
The Results section may be relatively concise because much of the numerical information can be efficiently communicated through tables and figures.
Study B: Multicenter clinical investigation
The study has:
- Multiple study sites
- Several thousand participants
- Multiple prespecified outcomes
- Safety analyses
- Subgroup analyses
- Sensitivity analyses
- Several figures and tables
A substantially longer Results section may be justified.
The metric is therefore not “more words = more rigorous.” Information density and completeness matter more than raw length.
How to Present Statistical Results Without Inflating Word Count
Statistical reporting can quickly make a Results section unnecessarily long.
Prioritize estimates that communicate magnitude and uncertainty.
Instead of reporting only:
“The difference was statistically significant (P < 0.05).”
provide the relevant estimate and measure of precision when appropriate:
“The intervention reduced symptom scores by 4.2 points compared with control (95% CI, −6.8 to −1.6; P = 0.002).”
This communicates substantially more information in a similar amount of text.
Where appropriate, report:
- Absolute numbers
- Percentages
- Effect estimates
- Confidence intervals
- Measures of variability
- P values
- Sample sizes
- Clinically relevant thresholds
Do not use statistical significance as a substitute for effect size or clinical importance.
The ICMJE recommends quantifying findings where possible and discourages reliance solely on hypothesis testing because P values do not communicate the magnitude or precision of an effect.
Avoid unnecessary statistical narration
Do not turn statistical output into prose line by line.
A manuscript should not read like:
“The mean was 42.6. The standard deviation was 5.3. The median was 42.0. The minimum was 29. The maximum was 58…”
unless each statistic is scientifically necessary.
Move detailed distributions into an appropriately designed table when possible.
Word Count Limits for High-Impact Journal Manuscripts
High-impact journals frequently impose strict article-length expectations, but these limits vary by journal and article type.
For example, Nature’s current author guidance describes typical Article lengths of approximately 2,500 words for a six-page article with four modest display items and approximately 4,300 words for an eight-page article with five to six modest display items. Nature also notes that display items occupy space and that essential technical details may be moved into Methods or Supplementary Information.
This illustrates an important publishing principle:
A word limit is not simply a text limit. It is an information-budget limit.
Every table, figure, equation, reference, and supplementary element contributes to how efficiently the research is communicated.
Before drafting, identify:
- Total manuscript word limit
- Abstract word limit
- Number of permitted figures
- Number of permitted tables
- Reference limit
- Supplementary-information policy
- Methods requirements
- Article-specific formatting requirements
Never assume that a word limit applies only to the main body. Journals define their counting rules differently.
Also read: How to Prepare Tables and Figures to Meet High-Impact Journal Standards in 2026: A 10-Step Guide
Common Mistakes That Make the Results Section Too Long
1. Repeating tables in prose
If the table contains 20 values, you rarely need 20 sentences explaining those values.
Highlight the clinically or scientifically important pattern and allow the table to provide the detailed record.
2. Repeating the Methods
Do not explain the complete statistical procedure again in Results.
A concise reminder may be appropriate, but methodological detail belongs primarily in Methods.
3. Discussing previous literature
Comparing your findings with previous studies generally belongs in Discussion.
The Results section should focus primarily on your own dataset.
4. Reporting every analysis performed
Exploratory analyses do not automatically belong in the main Results section.
Prioritize analyses relevant to the study objectives and clearly distinguish prespecified from exploratory analyses.
5. Creating excessive tables
More tables do not necessarily make a manuscript more rigorous.
Each table should have a clear purpose and should help readers understand the evidence. Redundant or low-value tables may be better suited to supplementary material.
6. Using Results as a data repository
A manuscript is not a statistical output archive.
The Results section should present the findings necessary for readers to understand the research contribution not every intermediate calculation produced during analysis.
A 7-Step Results Section Editing Workflow
Use this workflow before submission.
Step 1: Write the research questions at the top of the draft
Every major Results subsection should connect to a research question, hypothesis, or prespecified outcome.
Step 2: Mark the primary findings
Use a simple annotation system:
- P = primary finding
- S = secondary finding
- E = exploratory finding
- R = redundant information
Remove or relocate unnecessary R content.
Step 3: Audit every table and figure
Ask:
- Does this item answer a research question?
- Is the information duplicated elsewhere?
- Can the table be simplified?
- Does the text explain its most important finding?
Step 4: Separate observation from interpretation
Highlight sentences containing words such as “suggests,” “may indicate,” “could be explained by,” or “is likely due to.”
These may belong in the Discussion rather than Results, depending on context.
Step 5: Check statistical completeness
Verify:
- Sample sizes
- Absolute numbers
- Percentages
- Effect sizes
- Confidence intervals
- Appropriate P values
- Units of measurement
- Consistency with Methods
Step 6: Calculate your section proportion
Divide Results words by total main-text words:
Results proportion = Results word count ÷ total main-text word count × 100
Use the result as a diagnostic rather than a target.
If Results occupy 40% of a short manuscript, ask whether the study genuinely requires that much reporting or whether tables and supplementary material could improve efficiency.
Step 7: Compare the manuscript with the target journal
The final standard is always the target journal’s Instructions for Authors.
A manuscript can be scientifically sound and still require revision if it exceeds the journal’s word, table, figure, or formatting requirements.
Journal Article vs. Thesis Results Chapter: Key Differences
| Criterion | Journal Results | Thesis Results Chapter |
| Primary constraint | Journal word limit | University/degree requirements |
| Typical purpose | Concise presentation of publishable findings | Comprehensive documentation of research findings |
| Level of detail | Selective | Usually more extensive |
| Tables/figures | Limited by journal policy | Often more flexible |
| Supplementary data | Frequently used | Appendices commonly used |
| Discussion | Usually separate or integrated according to journal | May be separate or combined |
| Word-count target | Determined by journal and article type | Determined by thesis architecture |
| Main editing priority | Concision and evidence hierarchy | Completeness, organization, and argument development |
A Pre-Submission Results Section Checklist
Before submitting your manuscript, confirm that:
- The Results answer the stated research questions or hypotheses.
- The primary findings appear before minor findings.
- Results follow a logical sequence.
- Primary and secondary outcomes are clearly reported.
- Absolute numbers accompany percentages where appropriate.
- Effect sizes and uncertainty measures are reported when appropriate.
- Tables and figures do not duplicate one another unnecessarily.
- The text does not repeat every value in tables.
- Interpretation is reserved primarily for the Discussion.
- Exploratory analyses are clearly identified.
- Statistical terminology is used correctly.
- All tables and figures are cited in the text.
- The Results section complies with the target journal’s word-count rules.
- Reporting requirements such as CONSORT, STROBE, PRISMA, or STARD have been considered when applicable.
- The final manuscript has been checked for consistency between Methods, Results, tables, figures, and abstract.
Conclusion
There is no single research paper Results section word count that applies across disciplines or journals. A practical planning range of approximately 15–30% of the main manuscript can help authors allocate space, but the appropriate length ultimately depends on the study design, evidence base, journal requirements, and number of findings that must be reported.
The strongest Results sections are neither artificially short nor unnecessarily long. They present the evidence in a logical sequence, quantify important findings, use tables and figures efficiently, and preserve interpretation for the Discussion.
If your Results section feels too long, do not start by deleting scientifically important findings. First identify repetition, move detailed data into appropriate tables or supplementary material, and separate reporting from interpretation. If it feels too short, check whether every primary and secondary outcome has been adequately reported.
The objective is not to reach a magic word count. The objective is to give reviewers and readers enough evidence to understand exactly what the study found.
For a final manuscript audit, use professional ManuscriptLab editing and formatting services to review structure, reporting consistency, language, journal formatting, and submission readiness.