Researchers often know how many times their papers have been cited but that number alone does not tell them whether their research is performing well.
A paper with 25 citations may appear highly successful in one discipline and relatively ordinary in another. A five-year-old clinical study cannot be fairly compared with a six-month-old materials-science paper. Even researchers working in the same field can have dramatically different citation profiles because of publication year, article type, journal coverage, collaboration patterns, and database selection.
That is why academic citation benchmarking matters.
Citation benchmarking means comparing your citation performance against an appropriately defined group of comparable publications, researchers, institutions, or competitors. Instead of asking only, “How many citations do I have?”, you ask, “How does my citation performance compare with similar research published under similar conditions?”
This distinction is essential when evaluating journal article citation rates, preparing promotion or grant materials, assessing research visibility, or developing a publication strategy.
This guide explains how to benchmark citation performance systematically using Scopus and Web of Science, how to select meaningful competitors, which metrics to prioritize, and how to interpret the results without falling into common research-assessment traps.
💡 Need expert help with your paper?
Transform your manuscript with ManuscriptLab’s professional editing & formatting services!
What Does Citation Benchmarking Actually Mean?
Citation benchmarking is the process of measuring your citation performance against a defined comparison group.
A useful benchmark should control, as far as possible, for:
- Research field
- Publication year
- Publication type
- Database coverage
- Researcher or institutional output
- Citation window
- Geographic or collaboration profile, where relevant
The simplest metric is citation count:
Citation rate = Total citations ÷ Number of publications
For example, suppose Researcher A has:
- 40 publications
- 320 citations
Their average citation rate is:
320 ÷ 40 = 8 citations per publication
Researcher B may have 180 citations across only 10 publications:
180 ÷ 10 = 18 citations per publication
Researcher B has fewer total citations but a higher citation rate.
However, even this comparison can be misleading. If Researcher A works in a rapidly publishing field and Researcher B publishes in a field with slower citation accumulation, their raw averages are not directly comparable.
Responsible research assessment therefore increasingly emphasizes contextualized and normalized indicators, rather than raw citation counts alone. DORA recommends that quantitative research indicators be interpreted transparently, specifically, contextually, and fairly. (DORA)
1. Define Your Competitor Group Before Looking at the Numbers
The first step in how to measure research impact is not opening Scopus or Web of Science. It is defining whom you are comparing yourself against.
A “competitor” can mean several things:
- Researchers publishing in the same specialty
- Researchers at competing institutions
- Authors publishing in the same journals
- Researchers producing similar publication types
- Groups competing for the same grants, positions, or clinical influence
Do not create a competitor list based solely on reputation.
Instead, establish objective inclusion criteria.
Build a Comparable Researcher Cohort
A practical cohort might contain 10–30 researchers.
For example, a biomedical researcher studying colorectal cancer could compare their publication record with researchers who:
- Published at least 5 papers in the specialty during the last five years
- Work on similar disease mechanisms or interventions
- Publish in indexed journals
- Have comparable career stages
- Have substantial overlap in publication type
Career stage matters because citation accumulation is strongly time-dependent.
A senior researcher with 20 years of publications should not be treated as an equivalent benchmark for a researcher who completed a PhD two years ago.
Industry Standard Metric: Cohort Median
Use the median citation performance of the comparison group rather than relying exclusively on the mean.
Citation distributions are highly skewed. A small number of exceptionally cited papers can inflate the average dramatically.
For example:
| Researcher | Publications | Citations | Citations/Public. |
| A | 20 | 100 | 5.0 |
| B | 20 | 120 | 6.0 |
| C | 20 | 140 | 7.0 |
| D | 20 | 180 | 9.0 |
| E | 20 | 1,000 | 50.0 |
The mean is 15.4 citations per publication, but the median is 7.
The median gives you a much more realistic picture of typical performance.
Common Pitfall
Do not select only famous researchers with exceptionally high citation counts.
That creates an aspirational comparison rather than a valid benchmark.
Your benchmark should answer:
“How am I performing relative to genuinely comparable researchers?”
not:
“Why am I not performing like the most cited scientist in my discipline?”
2. Choose One Citation Database and Keep the Comparison Consistent
Citation counts vary between databases.
Scopus and Web of Science do not have identical journal coverage, indexing policies, document matching, or citation databases. Consequently, the same paper can display different citation counts in each system.
Scopus provides article-level metrics including total citations, citations per year, citation benchmarking percentiles, and Field-Weighted Citation Impact (FWCI). (www.elsevier.com)
Web of Science provides citation-performance information and normalized indicators such as Category Normalized Citation Impact (CNCI), Journal Normalized Citation Indicator (JNCI), and category percentiles. (Clarivate)
Scopus vs Web of Science for Benchmarking
| Criterion | Scopus | Web of Science |
| Raw citation count | Yes | Yes |
| Citation percentile | Yes | Yes |
| Field normalization | FWCI | CNCI |
| Journal-level indicators | CiteScore, SJR, SNIP | JIF, JCI |
| Author-level analysis | Yes | Yes |
| Database coverage | Broad multidisciplinary coverage | Curated Core Collection |
| Best use | Article, author and institutional benchmarking | Normalized citation and WoS-based research evaluation |
The important rule is simple:
Do not compare a Scopus citation count against a Web of Science citation count and treat the difference as performance.
Use the same database for both sides of the comparison.
For a broader understanding of how these databases differ, see our pillar guide on Scopus vs Web of Science: Which One Matters More.
3. Normalize for Publication Age
One of the most common errors in tracking scholar citation metrics is comparing papers solely by total citations.
A 2019 paper has had considerably more time to accumulate citations than a 2025 paper.
Instead, calculate an annualized measure.
Simple Citation Velocity
A basic calculation is:
Citation velocity = Total citations ÷ Years since publication
Suppose:
- Paper A: 60 citations over 6 years = 10 citations/year
- Paper B: 30 citations over 2 years = 15 citations/year
Paper B has fewer total citations but is currently accumulating citations faster.
However, citation velocity is a descriptive metric, not a universally standardized research-impact indicator. Citation accumulation is rarely linear, and newly published papers can take time to enter indexing databases and begin receiving citations.
Better Approach: Compare Similar Publication Windows
When possible, create cohorts such as:
- 2021–2022 publications
- 2023–2024 publications
- 2025 publications
Then compare papers within the same or similar publication windows.
This reduces the age-related distortion.
Common Pitfall
Do not interpret a rapidly increasing citation rate as permanent impact.
Citation patterns can change substantially as a field develops, a topic becomes less prominent, or a highly cited paper reaches a saturation point.
Also read: 10 Key Reasons Manuscripts Get Rejected Before Peer Review
4. Compare Citation Percentiles Instead of Raw Counts
Citation percentiles provide a more useful way to understand how a publication performs relative to comparable publications.
Instead of saying:
“My paper has 27 citations.”
you can ask:
“Where does my paper rank among comparable papers?”
Scopus provides citation benchmarking in percentile form. (www.elsevier.com)
Web of Science also incorporates citation percentiles and normalized citation-performance indicators into its research analytics.
For example, a paper in the 90th citation percentile has performed better than approximately 90% of papers in its relevant comparison set.
This is often more informative than a raw citation count.
Why Percentiles Matter
Consider two papers:
- Paper A: 50 citations, 70th percentile
- Paper B: 25 citations, 92nd percentile
Paper A has twice as many citations, but Paper B is performing much better relative to its benchmark cohort.
That distinction is particularly important for cross-disciplinary comparisons.
5. Use Field-Weighted Citation Impact for Cross-Field Comparisons
If you want to compare researchers from different disciplines, raw citation counts become increasingly problematic.
This is where field-normalized citation indicators become valuable.
What Is FWCI?
Field-Weighted Citation Impact compares the citations received by publications with the expected citation performance of similar publications.
In SciVal, an FWCI of:
- 1.00 = world average
- >1.00 = above the expected global average
- <1.00 = below the expected global average
For example, an FWCI of 2.0 indicates citation performance approximately twice the expected level for the relevant comparison group. Elsevier notes that the comparison accounts for publication year, publication type, and discipline. (Elsevier Support)
Why FWCI Is Powerful
Imagine two researchers:
- Researcher A: 8 citations per publication
- Researcher B: 15 citations per publication
At first glance, Researcher B appears substantially stronger.
But suppose:
- Researcher A’s FWCI = 1.8
- Researcher B’s FWCI = 0.9
Researcher A is performing substantially above expectations for their field, while Researcher B is performing below the field-normalized baseline.
The raw citation count tells only part of the story.
Common Pitfall: Small Samples
Do not overinterpret FWCI when a researcher has very few publications.
Elsevier specifically cautions that a small publication set can be heavily influenced by a handful of highly cited papers. (Elsevier Support)
Use normalized indicators alongside publication volume and the distribution of individual paper performance.
6. Compare Your Researcher Profile Using Multiple Metrics
A robust researcher competitor analysis should never rely on a single number.
Build a dashboard containing at least four dimensions:
1. Scholarly Output
Measure the number of relevant publications.
This provides context for citation totals.
2. Total Citation Count
This measures accumulated citation volume.
It is useful for understanding overall visibility but strongly affected by career length and publication volume.
3. Citations per Publication
This gives a simple productivity-adjusted citation measure.
It is useful for initial benchmarking but remains sensitive to field and publication age.
4. Normalized Citation Impact
Use FWCI, CNCI, citation percentiles, or a comparable normalized indicator where available.
This provides contextual information about how research performs relative to appropriate peers.
Add the H-Index Carefully
The h-index can be useful for understanding sustained citation performance, but it should not become the sole measure of research quality.
A researcher with an h-index of 20 and a researcher with an h-index of 10 may have very different publication histories, career lengths, fields, and collaboration patterns.
Metrics should therefore be interpreted as a portfolio rather than a leaderboard.
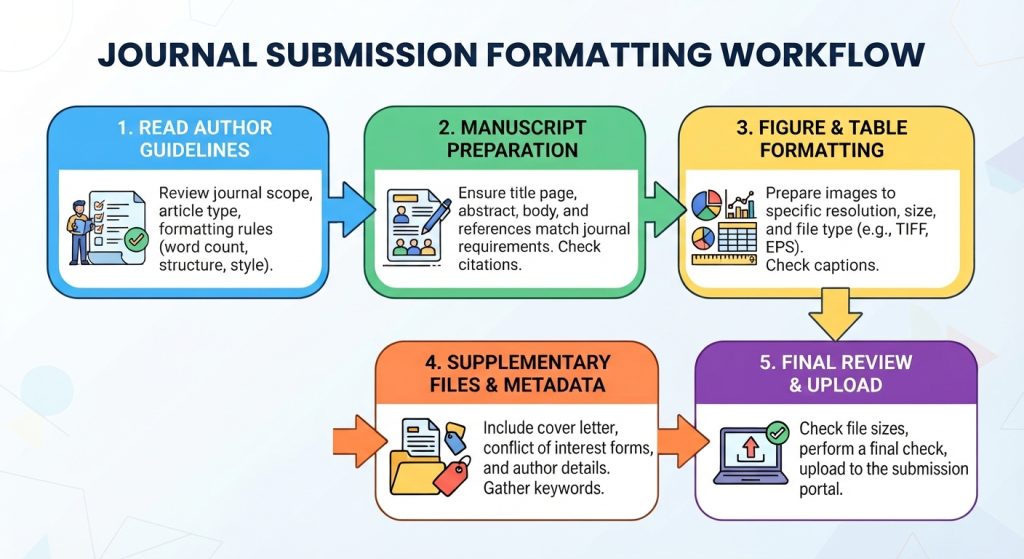
A Practical Citation Benchmarking Workflow
Define cohort → Select database → Collect publication data → Normalize by year and field → Calculate citation metrics → Compare percentiles → Analyze outliers → Identify gaps → Monitor quarterly
This workflow transforms citation tracking from a passive reporting exercise into an active research-impact strategy.
7. Analyze Citation Performance in Web of Science and Scopus
When analyzing citation performance in Web of Science and Scopus, record the data systematically.
Create a spreadsheet with fields such as:
| Field | Example |
| Author | Researcher A |
| Publication year | 2023 |
| Document type | Article |
| Journal | Journal X |
| Citations | 24 |
| Citations/year | 8 |
| Citation percentile | 85th |
| FWCI/CNCI | 1.65 |
| Research area | Oncology |
| Collaboration | International |
| DOI | 10.xxxx/xxxxx |
Then calculate:
Total citations
Citations per publication
Median citations per publication
Citation velocity
Median citation percentile
Average or median normalized citation impact
This dataset lets you distinguish between a researcher with consistently strong performance and one whose profile depends on a single highly cited publication.
Common Pitfall: Mixing Document Types
Review articles, original research papers, conference papers, editorials, and other document types can attract very different citation patterns.
Compare like with like whenever possible.
Clarivate’s normalized citation approaches account for variables such as field, document type, and publication year. (Clarivate)
8. Identify Your Citation Gap
Benchmarking becomes useful only when you convert the results into decisions.
Suppose your cohort produces the following median values:
- 12 citations/publication
- 75th citation percentile
- FWCI: 1.30
Your profile shows:
- 8 citations/publication
- 55th percentile
- FWCI: 0.95
You have identified a measurable citation-performance gap.
But do not immediately conclude that your research quality is poor.
Investigate why the gap exists.
Possible explanations include:
- Lower publication visibility
- Different journal distribution
- Fewer international collaborations
- Younger publication portfolio
- Smaller research community
- Lower discoverability
- Different document types
- Limited interdisciplinary reach
- Topic-specific citation behavior
This diagnostic stage is more valuable than simply trying to increase the citation count.
9. Turn Benchmarking Into an Improvement Strategy
Once you understand the gap, build an intervention plan.
Improve Discoverability
Use precise titles, informative abstracts, standardized keywords, and complete metadata.
Ensure your ORCID, institutional profile, and publication records are accurately connected where appropriate.
Target Relevant Journals
Journal selection should reflect audience, methodological fit, indexing, and readership not only Journal Impact Factor.
A paper published in the right journal can reach a much more relevant citation community.
Strengthen the Research Narrative
Clear abstracts and precise positioning make research easier for other researchers to identify and cite.
For researchers preparing manuscripts for submission, ManuscriptLab’s research publication support can help address manuscript preparation, publication strategy, editing, and submission requirements.
Build Legitimate Research Networks
International and interdisciplinary collaboration can expand the audience for research.
However, collaboration should be driven by genuine scientific contribution not citation manipulation.
ICMJE guidance emphasizes responsible authorship and accountability, while also stressing that references should accurately support the claims made in a manuscript. (ICMJE)
10. Avoid Citation Benchmarking Traps
Trap 1: Comparing Different Fields
Citation behavior varies substantially by discipline.
Fix: Use field-normalized indicators.
Trap 2: Comparing Different Career Stages
A senior investigator naturally has more accumulated citations.
Fix: Create career-stage or publication-year cohorts.
Trap 3: Chasing Citation Count
A high citation count does not automatically demonstrate research quality.
Fix: Combine citation counts with normalized indicators, publication context, and qualitative assessment.
Trap 4: Using Only One Database
Different indexing systems produce different results.
Fix: Choose a database and maintain consistency across the comparison.
Trap 5: Ignoring Highly Cited Outliers
One exceptional paper can distort averages.
Fix: Report median values, percentiles, and distributional information.
Trap 6: Encouraging Citation Manipulation
Excessive self-citation, reciprocal citation arrangements, or irrelevant citation insertion can undermine research integrity.
ICMJE recommends that references be directly relevant and warns against using references to promote authors’ or reviewers’ self-interests. (ICMJE)
Benchmarking should improve research visibility not encourage artificial citation inflation.
What Is a Good Citation Rate?
There is no universal citation rate that qualifies as “good.”
A meaningful benchmark depends on:
- Discipline
- Publication year
- Article type
- Journal
- Research topic
- Database
- Career stage
- Citation window
- Collaboration profile
A normalized metric around 1.0 generally represents approximately world-average performance within its defined comparison framework. Values above 1.0 indicate above-average normalized citation performance in metrics such as FWCI and CNCI. (Elsevier Support)
The correct question is therefore not:
“Do I have enough citations?”
It is:
“How does my citation performance compare with an appropriately matched peer group?”
That is the foundation of meaningful academic citation benchmarking.
How Often Should Researchers Benchmark Citation Performance?
For most researchers, a quarterly review is sufficient.
Monthly monitoring may be useful for a newly published high-priority paper, but citation databases update at different intervals and citations accumulate gradually.
For institutional research assessment, annual benchmarking is often more practical.
Maintain a historical record so that you can track:
- Citation growth
- Publication output
- Citation percentiles
- Normalized impact
- Highly cited papers
- Changes in research topics
- Collaboration patterns
This turns a single citation snapshot into a longitudinal research-impact profile.
FAQ: Academic Citation Benchmarking
How can I benchmark my citation rate against industry competitors?
Define a comparable peer cohort, use the same citation database for all researchers, control for publication year and field, and compare multiple indicators such as citations per publication, citation percentiles, and field-normalized citation impact. Avoid relying on raw citation counts alone.
What is the best metric for comparing citation performance?
There is no single universally best metric. Raw citations measure volume, citations per publication provide a simple productivity-adjusted view, while FWCI and CNCI provide field-normalized context. Use several metrics together.
Is Scopus or Web of Science better for citation benchmarking?
Both can support benchmarking. The critical requirement is consistency. If you benchmark competitors using Scopus, use Scopus data throughout the comparison rather than mixing Scopus and Web of Science citation counts.
How do I compare citations across different disciplines?
Use field-normalized metrics such as FWCI or CNCI and citation percentiles. These account for differences in citation behavior between research fields more effectively than raw citation counts. (Elsevier Support)
Should I use the h-index to benchmark myself against competitors?
Use it as one supporting metric rather than the primary benchmark. The h-index is influenced by career length, publication volume, field, and citation distribution, so it can obscure important differences between researchers.
How can I improve my citation performance?
Focus on producing rigorous, relevant research; selecting appropriate journals; improving discoverability; maintaining accurate publication metadata; building legitimate scholarly collaborations; and communicating findings to relevant research communities. Do not pursue artificial citation practices.
Pre-Benchmarking Checklist
Before comparing your citation performance, verify that you have:
- Defined a relevant competitor cohort
- Matched researchers by field and career stage
- Selected one primary citation database
- Recorded publication years
- Separated publication types
- Calculated citations per publication
- Examined median rather than only mean performance
- Reviewed citation percentiles
- Considered FWCI, CNCI, or another normalized metric
- Identified highly cited outliers
- Checked database coverage and author-profile accuracy
- Avoided interpreting citation counts without context
- Established a quarterly or annual monitoring schedule
- Converted the benchmark into a research-visibility strategy
Conclusion
Academic citation benchmarking is not a competition to accumulate the largest raw citation count. It is a structured method for understanding how research performs relative to comparable publications and researchers.
Start with a carefully defined cohort. Keep your database consistent. Control for publication age and discipline. Use percentiles and normalized indicators alongside citation counts. Then investigate the reasons behind any performance gap before deciding how to improve it.
The strongest benchmarking strategy combines quantitative evidence with responsible research assessment. DORA recommends contextual, transparent, and fair interpretation of research metrics, while major indexing systems such as Scopus and Web of Science increasingly provide normalized indicators designed to make citation comparisons more meaningful. (DORA)
When the objective is stronger research visibility, better journal targeting, and a more competitive publication record, benchmarking should become a recurring part of your research strategy not a number you check only when preparing a CV or grant application.
For researchers who need support beyond citation analysis, ManuscriptLab’s research publication support can help strengthen manuscripts and prepare research for the publication process.
Related Reading
Scopus vs Web of Science: Which One Matters More?
Field-Weighted Citation Impact(FWCI) vs Traditional H-Index for First-Time Authors